.png)
Reads to Leads is a newsletter for B2B tech founders and marketing leaders whose marketing isn’t working. It’s about positioning, messaging, content strategy, operations, and results. If this was sent to you, subscribe here so you don't miss the next email.
In today's newsletter:
Congratulations 🥳
You wrote mediocre content that Google thinks is slightly less mediocre than everyone else's.
One question: How many leads did that blog generate?
Meanwhile, that LinkedIn post with 300 impressions? It generated 3 qualified leads.
So which piece of content actually worked?
Top rankings aren't something to be sad about. Of course not. It's a great result! But it's not telling you what really matters.
Where you distribute it and what you want it to accomplish.
That's it.
But most marketing teams track the same numbers for everything:
This made sense when everyone was doing the same thing (SEO blog posts). Now marketing gets way more interesting.
Instead of universal metrics, match your measurement to your distribution channel and goal.
The framework: Channel → Goal → Metric → Monthly rating
Here's how it works for each major channel:
Goal: Grow followers → Track new followers per post. Compare to your average.
Goal: Generate leads → Track DMs and connection requests with business intent.
Goal: Drive traffic → Track click-throughs to your website. Compare to your post average, not industry benchmarks.
Goal: Build authority → Track meaningful engagement (shares + thoughtful comments). Two shares from industry leaders beats 20 likes from randoms.
Goal: Grow subscribers → Track new signups attributed to each issue. Did this issue drive more subscriptions than usual?
Goal: Generate leads → Track demo requests and consultation bookings from newsletter CTAs.
Goal: Build brand awareness → Track open rates and forward rates to evaluate if your message resonates with your audience. Consistent high opens mean your positioning and subject lines are working.
Goal: Generate leads → Track form submissions or demo requests from each post. A post that ranks for low-volume keywords but generates leads beats a post that ranks for high volume keywords but brings zero leads.
Goal: Support sales → Track how often sales uses your content in their process. Ask your sales team. Are they sending prospects this post?
Goal: Build authority → Track backlinks from credible sources and media mentions. One mention in an industry publication beats paid backlinks.
Complex dashboards look cool, but are complicated to use and often don't show you what matters. Unless you like to dig in. If you're not very enthusiastic about digging, just rate each piece of content 1-5 based on performance vs. your expectations:
Example: Your LinkedIn post got 10 new followers. Your average is 2. Rate it a 5.
Track monthly. Review quarterly. Use the ratings to guide future content decisions.
Pick one metric per piece of content based on its channel and goal. Do this before you write content to set expectations upfront.
What does "good" look like for this specific piece?
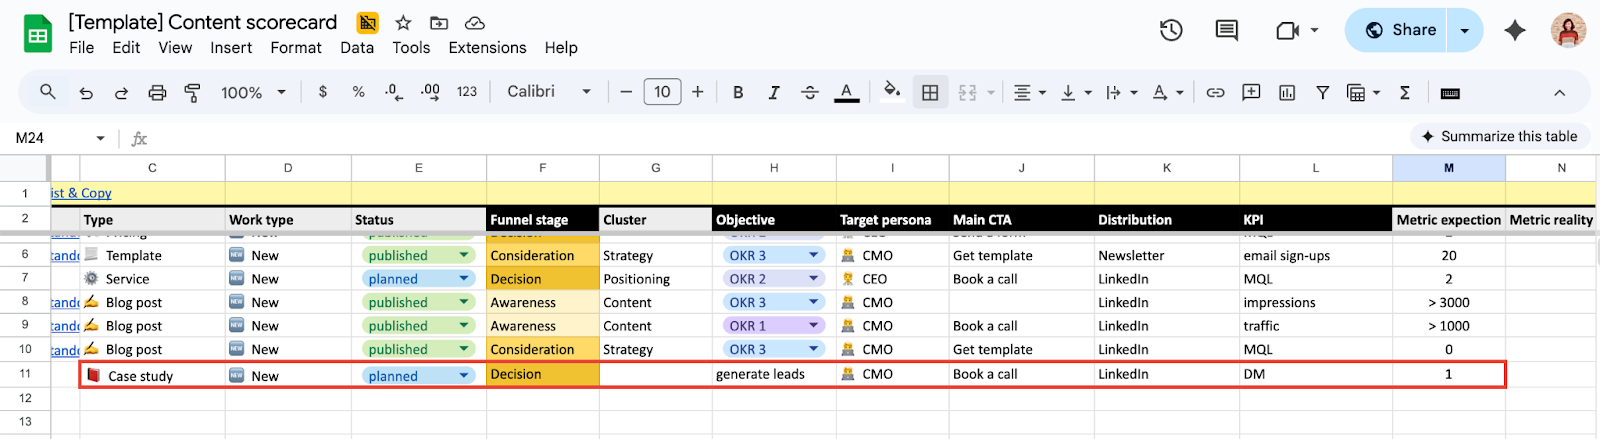
For example, say, you're planning to put together a case study to publish on the website. Your main "growth” channel for this case study is LinkedIn. Your goal is to generate leads. Your average BOFU content shared on LinkedIn gets 1 qualified DM. For this post, "good" would be 1 DM, "great" would be 3+.
Rate performance monthly using your gut plus the numbers.
Then create more of what actually works.
The goal is useful insights that help you make better content decisions.
A few months ago, I introduced the Content Scorecard - a system for evaluating content based on strategic alignment and performance.
I got a comment from a viewer on my YouTube channel:

The performance part is exactly what we covered today: matching metrics to channels and goals, then rating 1-5 based on results.
Going back to the case study example, here is how you can use the Scorecard to plan this piece of content strategically and then measure how it performs:
Set a metric expectation: e.g. aim for 1 inbound DM.
Give it 30 days. Track the actual number of DMs in the Metric Reality column.
Rate performance: assign a score from 1 to 5 based on how well it met the goal.
That's it!
We've now built this into a web app that walks you through scoring your content: content-score-audit.lovable.app
Try it on a few recent pieces. See which ones are actually working vs. which ones just have impressive vanity metrics.
Have fun!
When I first started Reads to Leads, I wrote it with one audience in mind: writers. I wanted to share what I'd learned about creating content people actually read and respond to.
But I've always been running an agency. That's where my real work (and my revenue) comes from. I help B2B tech companies nail their positioning, clarify their messaging, and create content that generates leads.
So it only makes sense that this newsletter evolves too.
Going forward, From Reads to Leads will focus more on positioning and strategy lessons from working with B2B tech clients and of behind-the-scenes of running and scaling my strategy + writing agency.
If you're in B2B tech or just curious about the business side of writing, I think you'll love what's coming.
If not, no hard feelings. You can unsubscribe anytime.
Kateryna
P.S. If we aren't connected already, follow me on LinkedIn and Instagram. If you like this newsletter, please refer your friends.
P.P.S. Zmistify your content with Zmist & Copy


What we've tracked across client work on what gets cited by AI, including content formats, writing, and distribution.
Subscribe to From Reads to Leads for real-life stories, marketing wisdom, and career advice delivered to your inbox every Friday.